Building a simple candlestick chart using Docker, FastAPI, and Vue 3 - Part 9
Emitting Events in Vue 3

Search for a command to run...
Emitting Events in Vue 3
No comments yet. Be the first to comment.
Set up a FastAPI backend to fetch stock data given a ticker, interval, and dates, create a Vue frontend to display the chart, and show how to create a Docker container for easy deployment.
Displaying the chart data
I'm working on a project in my new job and as part of the project I'm trying to register some components globally. As a company we're going to build out a component library and we want to be able to use some components without having to manually impo...
In the last blog post I built the functionality to handle form submission for the file upload itself, but we still didn't have a way to actually handle the files. In this post I'll set up the very basic markup as well as the accompanying script funct...
In the last blog post I touched on setting up a Google Drive folder to serve as the location of our uploads as well as creating the necessary endpoints for uploading and renaming the files. In this post I'll set up functions to send any necessary fil...

In the last blog post I set up a service account to authenticate for Google Drive's API, encrypted the resulting .json file, and set up functionality to decrypt said file to use for the purpose of actual authentication. In this post I will show you h...

Note: all credentials have already been destroyed so there is no need to let me know to not share credential information online. I just finished working on a project for a client/friend in which she wanted to have a page where she could have forms av...

In the last article we handled errors in the response from our FastAPI backend.
We also added in a bit of extra code to process the data, and the postProcessData method actually created data and volData elements, though we didn't do anything with it.
In this article we'll touch on emitting an event back to the parent component and passing data down to another component to use for charting purposes.
App.vueWe left off with data and volData elements defined in Selections.vue, and we need to somehow pass them up into App.vue and then down into another component that we'll create.
First, we need to actually return data from our postProcessData method.
We could just emit the event directly from that method but it's better to keep each method focused on its own purpose.
Thus, the updated method will look like
const postProcessData = (res) => {
  // Parse dates
  const formatDate = (d) => new Date(d).toISOString().substr(0, 10);
  const dates = res.map((e) => e.date).sort();
  state.startDate = formatDate(dates[0]);
  state.endDate = formatDate(dates[dates.length - 1]);

  // Format the data
  const data = res.map((e) => ({
    x: new Date(e.date),
    y: e.data,
  }));
  const volData = res.map((e) => ({
    x: new Date(e.date),
    y: e.volume ?? 0,
  }));

  return {
    series: [{data}],
    symbol: state.symbol,
    interval: state.interval,
    volume: [{name: 'volume', data: volData}]
  }
};
We are returning the data in this manner because we have already set four data elements in App.vue
const series = ref([]);
const symbol = ref('');
const interval = ref('Daily');
const volume = ref([])
Thus we will want to set these values for use in the eventual chart component, so formatting the emitted data in this manner will make things easier in general.
The series and volume data are formatted the way they are because the charting platform we'll be using is ApexCharts and the data structure needs to be in the format set above.
Then we need to update handleSubmit to get this data and emit it to the App.vue component.
const handleSubmit = async () => {
    v$.value.$validate();
    if (!v$.value.$invalid) {
        loading.value = true;
        try {
            const url = preProcessData();
            const res = await fetchData(url);
            const payload = postProcessData(res);

            emit('setData', payload);
        } catch (err) {
            console.log('err', err);
            dialog.value = true;
        }
        loading.value = false;
    }
};
In order to do this, we need to update our code in two other places.
First, we need to update the setup method in Selections.vue to include the emit handler
export default defineComponent({
  components: { JVPDialog, JVPInput, JVPSelect },
  emits: ['setData'],
  setup(_, { emit }) {
The _ in the setup method is because we're not actually using props anywhere in this component.
You can pass in the props argument but it won't do anything.
We then also need to listen for the event in App.vue.
This will involve adding the event listener onto the Selections element in the template, but also adding a method to handle this data in the setup function.
<template>
  <div class="h-screen bg-gray-200">
    <Selections class="px-4" @setData="setData" />
  </div>
</template>

<script>
import { defineComponent, ref } from 'vue';
import Selections from './components/Selections.vue';

export default defineComponent({
  components: { Selections },
  setup() {
    const series = ref([]);
    const symbol = ref('');
    const interval = ref('Daily');
    const volume = ref([]);

    const setData = (payload) => {
      console.log('in setData');
      console.log(payload);
    };

    return { series, symbol, interval, volume, setData };
  },
});
</script>
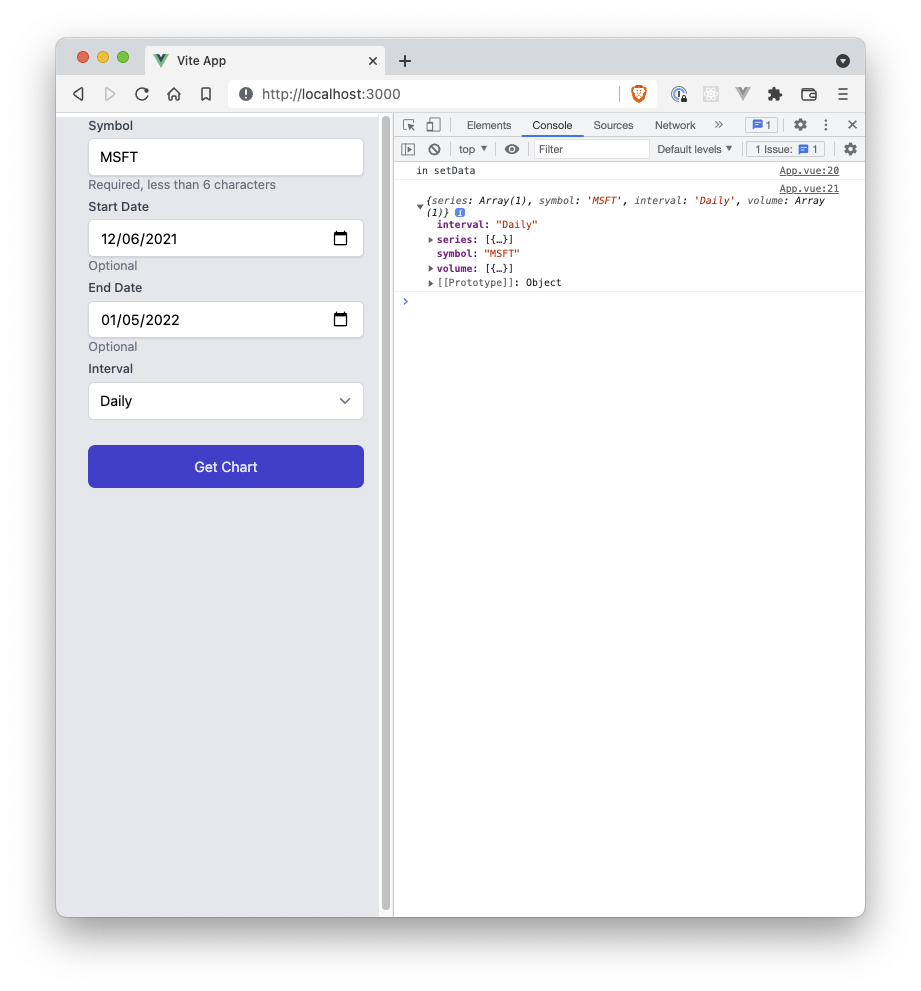
Upon making these adjustments and submitting a request for data for $MSFT the resulting console looks like
App.vueNow that we have the data in App.vue we will need to store it instead of just logging it to the console.
This is fairly straightforward
const setData = (payload) => {
  series.value = payload.series
  symbol.value = payload.symbol
  interval.value = payload.interval
  volume.value = payload.volume
}
This seems fairly verbose, though not debilitatingly so.
We now need a component to hold this data and eventually render the chart.
<template>
  <div>
    <div>
      {{ symbol }}
    </div>
    <div>
      {{ interval }}
    </div>
    <div>
      {{ series }}
    </div>
    <div>
      {{ volume }}
    </div>
  </div>
</template>

<script>
import { defineComponent } from 'vue';
export default defineComponent({
  props: {
    symbol: {
      type: String,
      required: true,
    },
    interval: {
      type: String,
      required: true,
    },
    series: {
      type: Array,
      required: true,
    },
    volume: {
      type: Array,
      required: true,
    },
  },
  setup(props) {
    return {
      ...props,
    };
  },
});
</script>
We then update App.vue to include this component
<template>
  <div class="h-screen bg-gray-200">
    <Chart
      :series="series"
      :symbol="symbol"
      :interval="interval"
      :volume="volume"
    />
    <Selections class="px-4" @setData="setData" />
  </div>
</template>

<script>
import { defineComponent, ref, reactive } from 'vue';
import Selections from './components/Selections.vue';
import Chart from './components/Chart.vue';

export default defineComponent({
  components: { Selections, Chart },
  setup() {
    const series = ref([]);
    const symbol = ref('');
    const interval = ref('Daily');
    const volume = ref([]);

    const setData = (payload) => {
      series.value = payload.series
      symbol.value = payload.symbol
      interval.value = payload.interval
      volume.value = payload.volume
      console.log('data fetched and set')
    };

    return { series, symbol, interval, volume, setData };
  },
});
</script>
And we click the button to fetch the data and we get the following
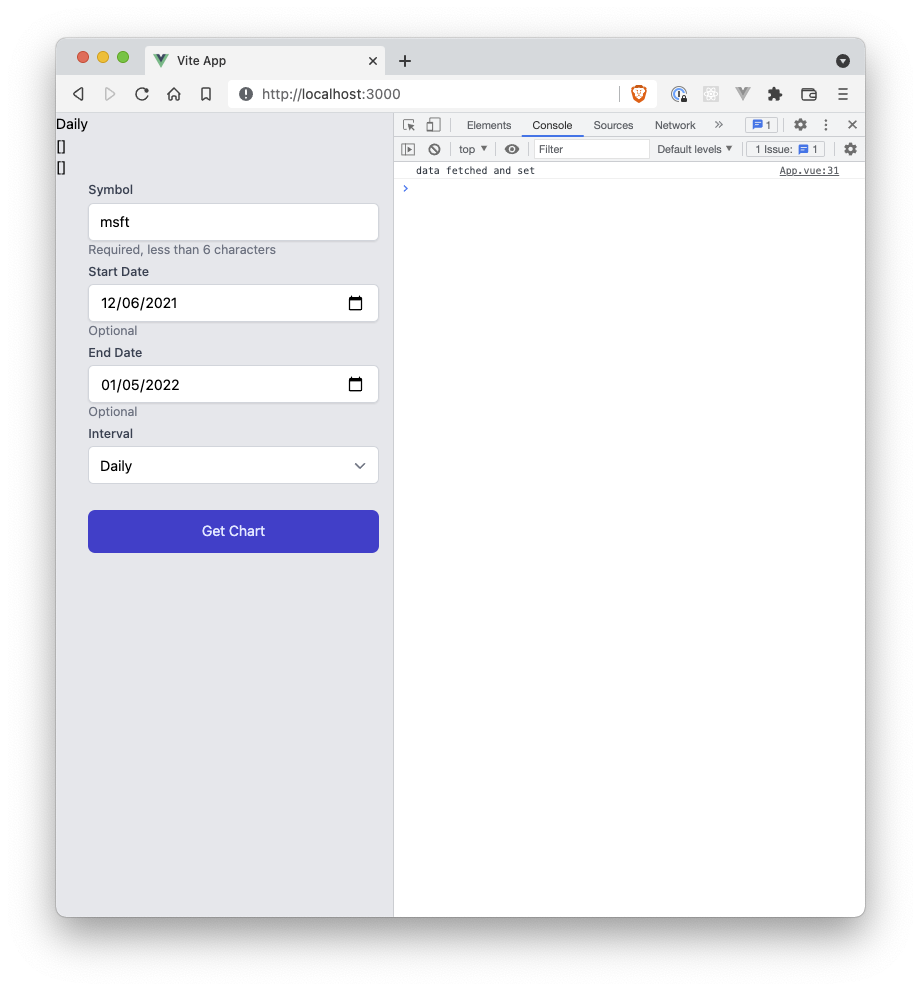 which doesn't make any sense since the data has clearly been set in
 App.vue.
What's actually happening is
Chart.vue component is mounted with data that exists in App.vue at firstSelections.vue and passed up to App.vueChart.vueChart.vue to check to see if props changed to trigger a re-render!!!There are a few ways that we can make sure that Chart.vue will watch the props and re-paint the DOM when data are updated.
The most straight-forward way is to make all four elements computed properties in Chart.vue.
We will need to import computed at the top of the script tag, and then do the following
setup(props) {
  const symbol = computed(() => props.symbol.toUpperCase());
  const interval = computed(() => props.interval);
  const series = computed(() => props.series);
  const volume = computed(() => props.volume);
  return {
    symbol,
    interval,
    series,
    volume,
  };
},
Computed properties are like reactive elements in a Vue component.
Any time the data inside the anonymous function for the computed property is updated then the resulting element will also update.
We could utilize watchers but again, this is a fairly straightforward solution for what we need.
Upon doing this and fetching the data again we see
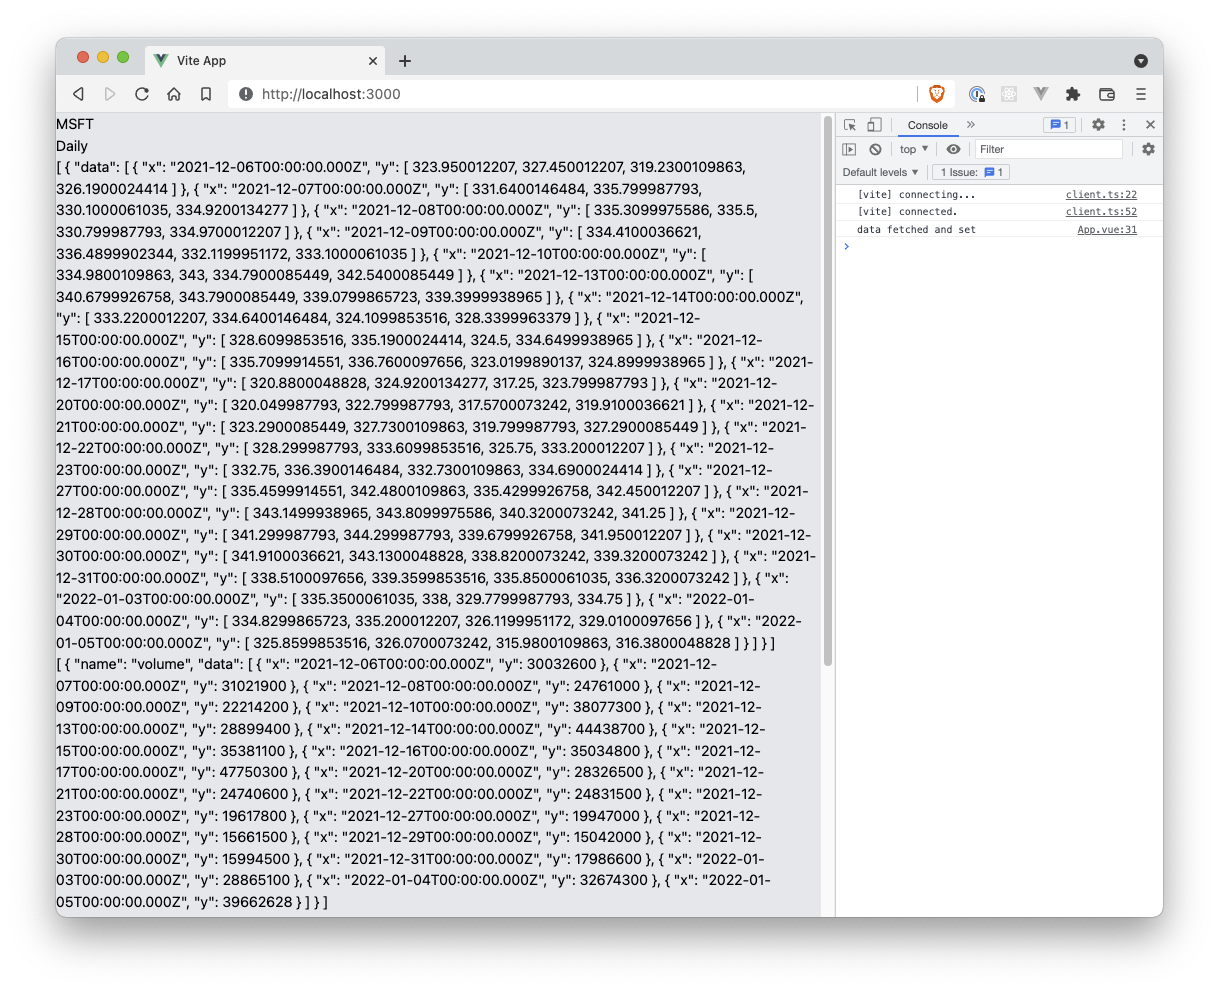
and we have the updated data as anticipated.
In the next article we'll install and include Vue3 ApexCharts to render out the stock chart as well as the volume chart.